Welcome to my CFD portfolio. I am an aerospace engineering graduate with a strong interest in aerodynamics.
This portfolio presents a selection of CFD projects carried out using OpenFOAM across a range of engineering applications.
Engineering has always been closely connected to my curiosity about how things move, interact and perform. Cars have been part of
my life since childhood, from racing video games and motorsport to rental karting, sim racing and, more recently, racing in a Rotax DD2 kart.
This passion naturally encouraged me to explore the technical principles behind performance.
During my aerospace engineering studies, discovering fluid mechanics gave this curiosity a new dimension. I became fascinated by the way
fluid flows can be understood through physics, numerical methods and experimentation. CFD particularly appealed to me because it makes complex
phenomena visible and provides a powerful way to analyse, understand and improve engineering systems.
Although automotive aerodynamics remains one of my main interests, my interests are not limited to vehicles. The same physical principles can be
applied to other fields, such as aerospace. I enjoy exploring these different applications, developing new technical skills, and approaching each
project with curiosity, rigour, and a desire to understand the physics behind the results.
My CFD Projects
Automotive CFD Simulations
CFD studies presenting the main stages of geometry
preparation, meshing, numerical setup and post-processing.
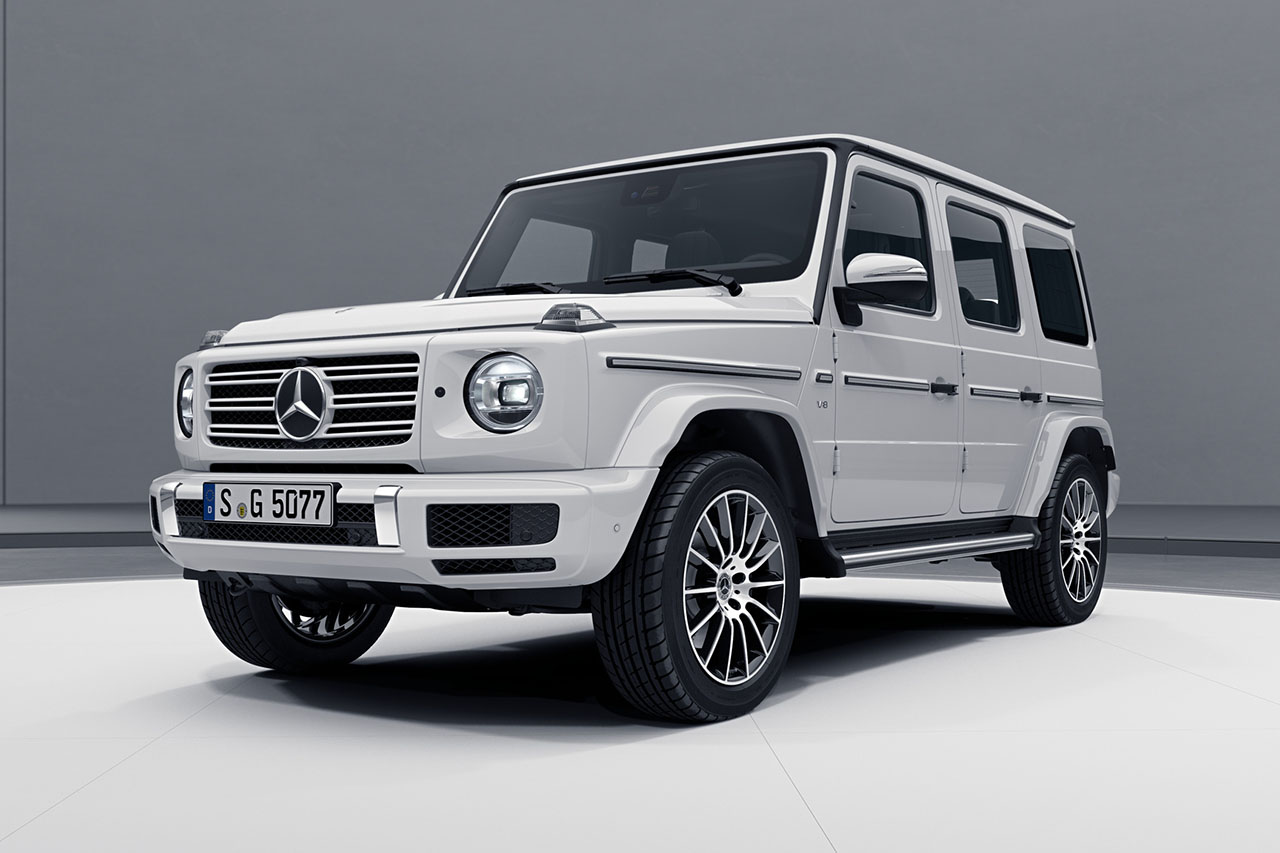
Mercedes G-Class W463
Steady-state incompressible simulation
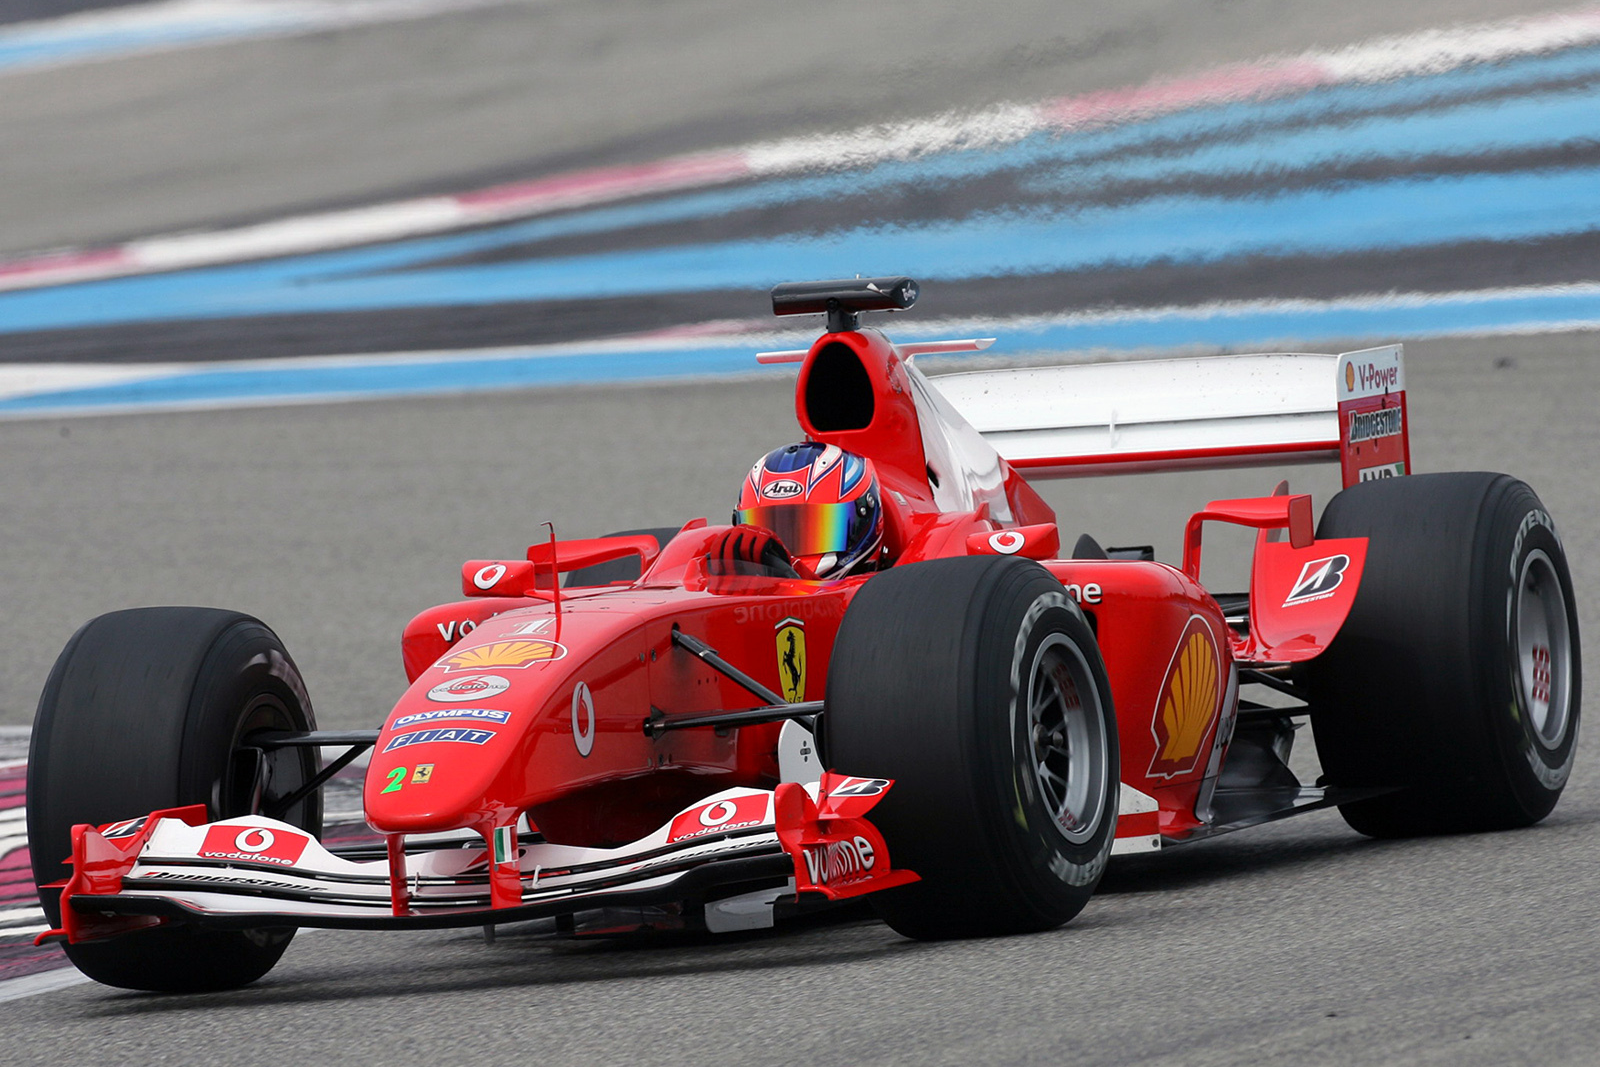
Ferrari F2004
Steady-state incompressible simulation
CFD Reports
Complete CFD studies presented as reports, including the
methodology, numerical setup, results and conclusions.
The goal of this project is to carry out a CFD simulation of the 2018
Mercedes G-Class W463 using OpenFOAM.
The Mercedes-Benz G-Class is an iconic vehicle, originally designed in
the late 1970s as a robust and versatile off-road model. Over the
decades, it has become a symbol of durability and prestige, while
retaining its characteristic boxy design and high ground clearance.
Using a simplified geometry instead of the original reduces the
complexity of the mesh, leading to faster preprocessing, lower
computational cost, and improved numerical stability. However, since it
is not the exact geometry, it cannot capture the full physical realism.
The goal of this study, however, is to gain insights and identify flow
trends, and the geometry used here is sufficient to achieve these
objectives.
3. Physics/Numerics
Steady state
Constant density, ρ = 1.2 kg·m-3
k-ω SST turbulence model
Second-order schemes
4. Boundary conditions
Flow velocity, U = 30 m·s-1 = 108 km·h-1,
with moving ground and rotating wheels
Freestream turbulence values from Spalart and Rumsey, using a
reference chord length of 1.85 m (height of the car). This leads to:
k = 0.0009 m2·s-2
ω = 90.91 s-1
5. Fluid domain
The car length is L = 4.6 m. The fluid domain used is the following:
6. Meshing
a. General mesh
Meshing with snappyHexMesh
Refinement of the tires
Two refinement boxes around the car: one at 0.5 m (fine) and another
at 2 m (coarser)
Three progressively coarser refinement boxes to capture the car’s
wake
b. Mesh quality
18,224,493 cells with a dominance of hexahedral cells (17,315,550)
Maximum aspect ratio: 30.63
Mesh non-orthogonality: max = 64.98, average = 5.97
Maximum skewness: 3.2
c. Inflation layers
Six layers with a final layer thickness of 30% relative to the
surface mesh and an expansion ratio of 1.2
Aim of 30 < y+ < 300 on the entire car and the ground
The following images show the distribution of y+ on the car within the
range of 30–300. Most of the car falls within the range, except for
certain areas, particularly around the windshield.
d. Visualisation of the mesh
7. Solving
simpleFoam solver
The case was run until all force coefficients no longer varied
The simulation was performed for 7500 iterations on 4 cores
8. Post-processing
a. Drag and lift forces
The following forces represent the forces acting on the car along the X
and Z directions :
Fx [N]
Fz [N]
972.19
-185.557
b. Drag and lift coefficients
In aerodynamics, lift and drag forces are typically normalized by the product of the freestream
dynamic pressure and a reference area, allowing comparisons between different flow conditions
and geometries. The resulting dimensionless quantities are the lift and drag coefficients,
denoted CL and CD, respectively. The reference area used to calculate the coefficients is
Aref = 3.17 m2.
CD
CL
0.571
-0.104
c. Pressure coefficient
The pressure coefficient, Cp, is a dimensionless quantity used to describe how the local static
pressure differs from the freestream pressure. It is calculated by dividing this pressure difference by
the freestream dynamic pressure. This normalization makes it possible to compare pressure distributions
obtained under different flow conditions. A positive Cp indicates a pressure above the freestream
value, while a negative Cp indicates a lower pressure.
d. Velocity
e. Skin-friction coefficient
The skin-friction coefficient, Cf, is a dimensionless quantity that measures the friction exerted by the airflow
on a surface. It is obtained by normalizing the wall shear stress by the freestream dynamic pressure. In the Cf images,
Line Integral Convolution (LIC) is used to visualize the direction of the wall shear stress and, therefore, the direction
of the flow near the surface.
f. Streamlines
The next image is obtained using Surface LIC (Line Integral
Convolution) on a slice plane.
g. Total-pressure coefficient
Total pressure represents the mechanical energy carried. For an incompressible flow, it is the sum
of the static and dynamic pressures. The total-pressure coefficient, CpT, is defined
as the difference between the local total pressure and the freestream static pressure,
normalized by the freestream dynamic pressure. It is particularly useful for identifying
regions where the flow has lost energy, due to viscous effects for example.
The following images show the isosurface of the total-pressure
coefficient at a value of 0. This representation helps identify the
sources of drag.
9. Conclusion
In this report, I will not provide a detailed explanation of the car’s
aerodynamics, as this is not the main objective of the project, but I
will give a brief overview.
The first and most obvious observation is that the G-Class has poor
aerodynamic performance, as reflected by its high drag coefficient.
This vehicle was not designed for aerodynamic efficiency but rather for
off-road capability. One major drawback is its height, which generates a
large wake zone behind the car. The isosurface plots of CpT clearly show
this effect, with a significant volume associated with drag generation.
The general shape of the car also creates problems. Its boxy geometry,
especially the flat front, makes it difficult for the airflow to escape
smoothly, resulting in regions of high pressure and therefore increased
drag. The elevated body exposes the wheels directly to the flow, which
further adds to drag. Finally, the windshield is not inclined enough,
which also increases drag.
Ferrari F2004 Numerical Simulation
1. Introduction
The goal of this project is to carry out a CFD simulation of the
Ferrari F2004 using OpenFOAM.
The Ferrari F2004 is one of the most iconic and dominant single-seaters
in Formula 1 history. Designed by Scuderia Ferrari for the 2004 World
Championship season, it was the result of the work of Rory Byrne
(aerodynamics and design), Ross Brawn (technical director) and Paolo
Martinelli (engine). Powered by a 3.0-litre naturally aspirated V10
engine, the Ferrari Tipo 053, the F2004 combined raw power, remarkable
reliability and aerodynamic efficiency.
This single-seater distinguished itself through its unrivalled
dominance, giving Michael Schumacher his seventh and final world title
and Ferrari its sixth consecutive constructors' title. It won 15 of the
18 races in the 2004 season, making it one of the most successful cars
in history.
The aerodynamics of the F2004 represented the culmination of the V10
era, before the major regulatory changes introduced in 2005. It was
notable for its exceptional balance between downforce and drag,
efficient flow management around the sidepods and a high-performance
rear diffuser. Its design was a refined evolution of the F2003-GA, with
a lighter chassis, a lower centre of gravity and outstanding mechanical
reliability.
The car model is simplified in several areas. The seat is fully closed
to prevent airflow from entering the cockpit, and only the driver’s head
is kept, as it has a significant impact on drag. Smaller aerodynamic
details such as winglets on the sidepods and some bargeboard elements
are left out. The side deflector attached to the sidepod is also
missing, as well as the mirrors and supports of the bargeboards.
Regarding the underbody, it may not match the original one, since
finding accurate references is difficult.
The air intakes are not modelled as functional. In reality, the airflow
would be directed into the engine or radiators, but here they are closed
surfaces, meaning that the flow simply impacts them. On the other hand,
the front and rear wings are close to the real design. I am aware that
the absence of some elements can cause deviations compared
with the actual car, but the objective of this project is to capture the
general airflow trends around this Formula 1 car.
3. Physics/Numerics
Steady state
Constant density, ρ = 1.225 kg·m-3
k-ω SST turbulence model
Second-order schemes
4. Boundary conditions
Flow velocity, U = 50 m·s-1 = 180 km·h-1,
with moving ground and rotating wheels
Symmetry plane, with half of the car simulated
Freestream turbulence using a reference length of 2.42 m, based on
the wheelbase, and a turbulence intensity of 1%. This leads to:
k = 0.375 m2·s-2
ω = 0.59399 s-1
5. Fluid domain
The car length is L = 4.47 m. The fluid domain used is the following:
6. Meshing
a. General mesh
Mesh generated with snappyHexMesh
Refinement of the tires, front wing, rear wing, underbody and
bargeboards
Two refinement boxes around the car: one at 0.5 m (fine) and another
at 1 m (coarser)
Three progressively coarser refinement boxes to capture the wake of
the car
b. Mesh quality
20,940,958 cells, with a dominance of hexahedral cells (93%)
Maximum aspect ratio: 30.0128
Mesh non-orthogonality: maximum = 64.9858 and average = 7.26472
Maximum skewness: 3.93352
c. Inflation layers
Five layers with a final layer thickness of 40% relative to the
surface mesh and an expansion ratio of 1.2
The resulting average y+ value over the entire car and ground is
approximately 44, which requires the use of wall functions
The following images show the distribution of y+ on the car within the
range of 30–300. Most of the car falls within this range, except for
certain areas, particularly around the rear suspension.
d. Visualisation of the mesh
7. Solving
simpleFoam solver
The GAMG (Geometric Algebraic Multi-Grid) solver is used for the
pressure equation, while PBiCGStab (Preconditioned Bi-Conjugate
Gradient Stabilized) is selected for velocity and turbulence
variables equations
The simulation was run for 5000 iterations
Running on 4 cores, it took 6 days
It took approximately 1000 iterations to reach a pseudo-steady state.
I then decided to start averaging the coefficients from iteration
2000
8. Post-processing
a. Drag and lift coefficient results
When assessing the aerodynamic performance of vehicles, aerodynamic coefficients
alone do not always provide the most relevant comparison, as vehicle dimensions
are constrained and cannot simply be scaled up or down. For example, a vehicle
can have a lower lift coefficient than another while generating more lift because
of its larger reference area. It is therefore useful to consider the products SCL
and SCD, commonly referred to as lift area and drag area. At a given dynamic pressure,
these quantities are directly proportional to the lift and drag forces. In this study, the reference area is S = 1.24 m².
SCL [m²]
SCD [m²]
|CL/CD|
-0.997
0.897
1.11
b. Downforce and drag contributions of the different components
The following images show the forces in the X and Z directions. They
help to understand the drag and downforce produced by each component.
Components
Downforce contribution [%]
Drag contribution [%]
Bodywork + Suspension + Driver
-46.66
34.19
Underbody
78.88
7.24
Front tire
1.55
15.95
Front wing
28.95
2.83
Rear tire
1.86
17.66
Rear wing
36.97
13.59
Bargeboards
-1.55
8.53
As shown in the table, most of the downforce is generated by the
underbody, rear wing and front wing. The underbody plays a crucial role
in a Formula 1 car, as it produces the majority of the downforce. In
terms of drag, the bodywork accounts for the largest contribution.
c. Pressure coefficient
The pressure coefficient, Cp, is a dimensionless quantity used to describe how the local static
pressure differs from the freestream pressure. It is calculated by dividing this pressure difference by
the freestream dynamic pressure. This normalization makes it possible to compare pressure distributions
obtained under different flow conditions. A positive Cp indicates a pressure above the freestream
value, while a negative Cp indicates a lower pressure.
d. Velocity
e. Skin-friction coefficient
The skin-friction coefficient, Cf, is a dimensionless quantity that measures the friction exerted by the airflow
on a surface. It is obtained by normalizing the wall shear stress by the freestream dynamic pressure. In the Cf images,
Line Integral Convolution (LIC) is used to visualize the direction of the wall shear stress and, therefore, the direction
of the flow near the surface.
f. Streamlines
The next image is obtained using Surface LIC (Line Integral
Convolution) on a slice plane.
g. Total-pressure coefficient
Total pressure represents the mechanical energy carried. For an incompressible flow, it is the sum
of the static and dynamic pressures. The total-pressure coefficient, CpT, is defined
as the difference between the local total pressure and the freestream static pressure,
normalized by the freestream dynamic pressure. It is particularly useful for identifying
regions where the flow has lost energy, due to viscous effects for example.
The following video represents the isosurface of the total-pressure
coefficient when it is equal to 0. This representation helps identify
the main sources of drag.
9. Conclusion
In this project, the goal was not to perfectly replicate the real
aerodynamic performance of the Ferrari F2004, but rather to understand
the main flow structures and aerodynamic behaviour.
The results highlight how each component contributes to downforce and
drag, confirming the crucial role of the underbody and wings in
achieving aerodynamic efficiency. Overall, this simulation provides
valuable insight into how race cars balance downforce and drag.